Getting Started Monitoring SharePoint Online With Application Insights
-
 Nigel Browne
 - Jun 09, 2017

If you’re like me, you might get a little obsessed with performance and want the best experience for your users. That eventually leads to wanting to have reliable metrics for your SharePoint online tenant. In our case, I wanted better information about our SharePoint based intranet than what I was able to get from our existing web analytics platform. So, I did what any self-respecting geek would do; I threw more instrumentation at the problem.
What’s Application Insight And Why Would I Use it?
Application Insights is Microsoft’s all singing, all dancing, application performance, analytics, and diagnostics platform. Generally, I use it to get data on custom built applications, but you can also use it for the client-side data of SharePoint Online. You’ll notice I said, rather specifically, “client-side” data. Since we don’t have access to the back-end of the cloud we can’t get the server-side telemetry. Nevertheless, the client-side data is gold.
Getting Started
Before you can add Application Insights, you’ll need:
- An Azure account to setup an Application Insight instance
- Permissions to edit the master page of the SharePoint site that you want creepy-level tracking data about
Create the Application Insights Instance
- Login to your Azure Portal
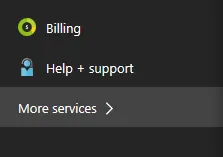
- Click on “More Services” on the main menu blade
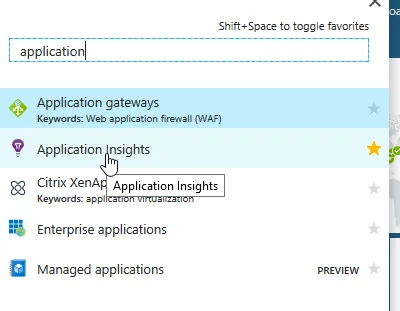
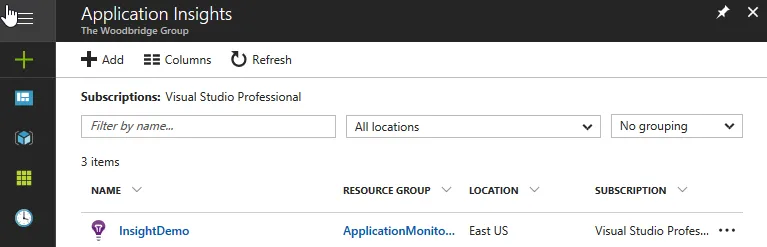
- Use the search filter to find “Application Insights” and click on it
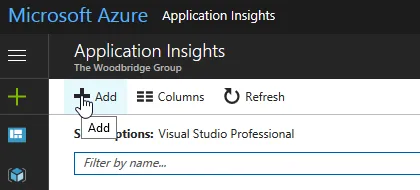
- Click on ”+ Add” to create a new instance
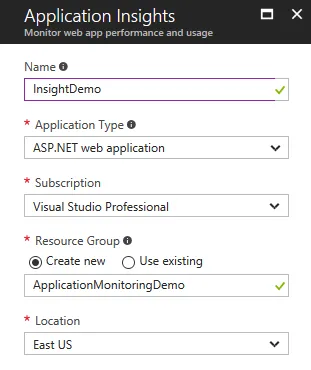
- Give you new instance a name, select the “ASP.Net web application”, and either create a new resource group or pick and existing one. Once you have that filled out, click on “Create” at the bottom. Optionally, you can click on the “Pin to dashboard” option so it appears on your dashboard.
- Grab a coffee or adult beverage while Azure deploys your new Application Insights instance
- You should now see the new instance in the list; click on it to load it
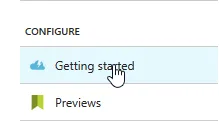
- Under “Configure” in the menu, click on “Getting Started”
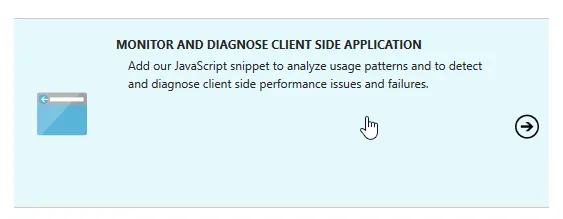
- Next, select “Monitor and Diagnose Client Side Application”
- You’ll see the chunk of code that needs to be added to your master page, click on the “Copy” icon to copy it to your clipboard.
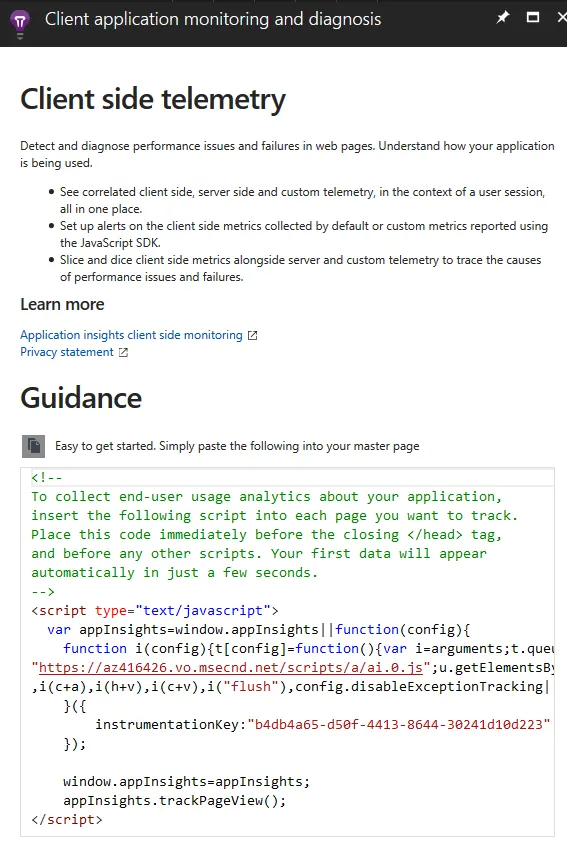
Add The Monitoring Script to Your Master Page
To get the application telemetry, you’ll need to add the script to your site’s master page. The neat thing is that the short bit of script will automatically grab the full Application Insight package from a CDN and load it.
Note: You can also use SharePoint Designer to edit the master page and I find that’s MUCH faster, but it’s not for everyone…
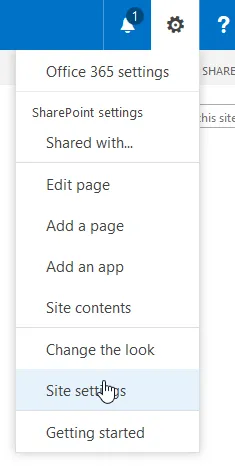
- Open the “Site Settings” for the site you want to edit
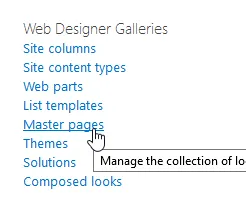
- Click on “Master pages” in the “Web Designer Galleries” section
- Download the master page you want to edit, in my example I’m updating the oslo.master. Your mileage may vary here…
- Locate the closing tag and paste in the code you copied earlier immediately before the . It’ll look something like this:
   ...
   <head>
   ...
   <SharePoint:CssRegistration Name="Themable/oslo.css" runat="server" EnableCssTheming="true" />
      <script type="text/javascript">
         var appInsights = window.appInsights || function (config) { function i(config) { t[config] = function () { var i = arguments; t.queue.push(function () { t[config].apply(t, i) }) } } var t = { config: config }, u = document, e = window, o = "script", s = "AuthenticatedUserContext", h = "start", c = "stop", l = "Track", a = l + "Event", v = l + "Page", y = u.createElement(o), r, f; y.src = config.url || "https://az416426.vo.msecnd.net/scripts/a/ai.0.js"; u.getElementsByTagName(o)[0].parentNode.appendChild(y); try { t.cookie = u.cookie } catch (p) { } for (t.queue = [], t.version = "1.0", r = ["Event", "Exception", "Metric", "PageView", "Trace", "Dependency"]; r.length;)i("track" + r.pop()); return i("set" + s), i("clear" + s), i(h + a), i(c + a), i(h + v), i(c + v), i("flush"), config.disableExceptionTracking || (r = "onerror", i("_" + r), f = e[r], e[r] = function (config, i, u, e, o) { var s = f && f(config, i, u, e, o); return s !== !0 && t["_" + r](config, i, u, e, o), s }), t }({ instrumentationKey: "xxxxxxx-xxxx-xxxx-xxxx-xxxxxxxxxxxx" });

         window.appInsights = appInsights;
         appInsights.trackPageView();
      </script>
   </head>
   <body>
- Save the file, upload it back to SharePoint and then publish the new version and you’re done!
- You can now return to your Application Insights instance and start analyzing all the creepy tracking data that it captures
Gotchas and Potential Problems
- After setting up Application Insights to monitor our intranet and being ridiculously impressed with the metrics and when it proactively emailed me about a problem, I was ridiculously annoyed to find out my MSDN subscription won’t let me increase the amount of data that’s logged each day. You can fix this by switching to a pay-as-you-go or using your enterprise agreement.
- If other people need to access the data, you’ll need to use the “Access control (IAM)” menu to add them to the appropriate role. Selecting the right role is another discussion for later.